Darío Cabezas Larese
Understanding
intelligence.
Making it useful.
I’m an AI researcher, data scientist and independent builder. I investigate how models learn, put machine learning to work, and make software of my own.
A question of structure.
From mathematical ideas to things people can use.
Currently, across
three connected worlds.
01 / SELECTED WORK
Ideas, tested in different ways.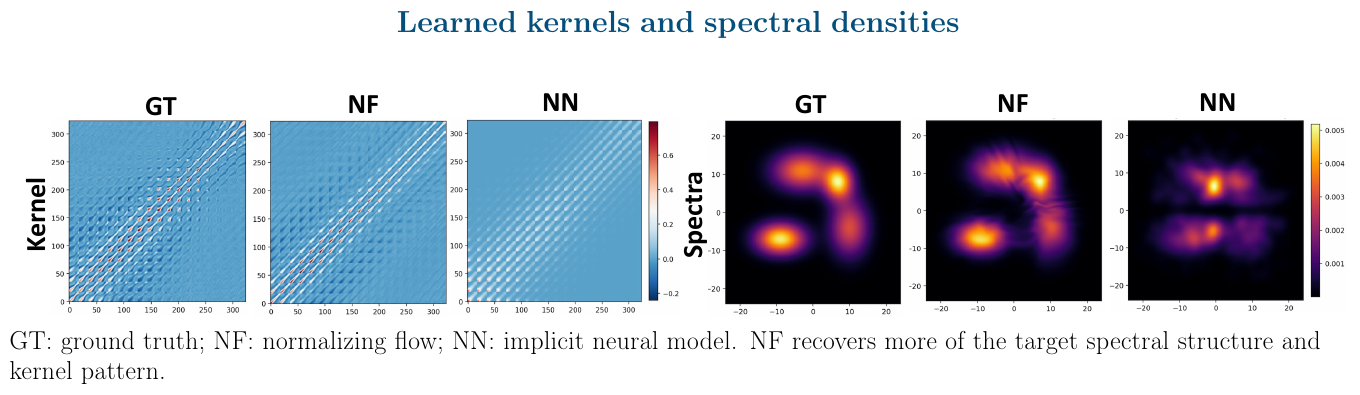 Original research figure · Yang et al., 2026
FEATURED RESEARCH · NEURIPS 2026
Learning how
attention sees.
What if a transformer could learn a richer notion of similarity? Our work explores nonstationary attention kernels, shaped by normalizing flows.
Flow-based Spectral Kernel Learning for Nonstationary Attention · Coauthor, fourth in author order.
Explore the research ↗Watch my explanation ▶AI beyond
the prototype.
Classification and entity resolution for the complexity of enterprise data.
Explore my industry work ↗INDEPENDENT PRODUCT / iOS Quickie.
A little less friction.
A little more clarity.
Personal finance tracking for everyday life. Independently built, with launch in preparation.
Meet Quickie ↗02 / ONE THREAD, THREE PERSPECTIVES
Investigate.
I study attention, probabilistic modeling and time series. The starting point is a question; the standard is an experiment.
↗Apply.
I turn messy organizational data into useful machine learning systems, with evaluation and engineering close to the model.
↗Build.
I make independent products to explore the whole journey: from an everyday problem to an interface someone can use.
↗FIRST-AUTHOR RESEARCH / IEEE · 2025
What can a railway
tell us through vibration?
Changing speeds and loads make axle vibrations difficult to predict. I investigate how transformer models can help us understand these signals.
Read the research story ↗A SMALL EXPLORATION
The past changes
what comes next.
In a Hawkes process, each event raises the rate of future events. Its influence then decays. Add an event and see the history accumulate.
Illustrative exponential Hawkes process. Synthetic events, arbitrary time units; not patient data or a clinical prediction.
The mathematical idea
λ(t) = μ + Σ α exp(−β(t − tᵢ)), summed over tᵢ < t. Here μ = 0.3, α = 0.7 and β = 0.8; α/β < 1. The curve shows the conditional rate given the selected event history, not an event probability.
03 / THE PATH SO FAR
From data systems
to new questions.
Research and engineering inform each other. My work has grown across both, with independent building alongside them.
A little more about me ↗WPP
Data Scientist, Global Functions
UC3M
AI Research Scientist
Sandoz
Data Scientist, Global Functions
BIsiona
Data engineering & business intelligence
AN OPEN CONVERSATION
Have an
interesting problem?
I’m open to research conversations and selected independent collaborations in machine learning and AI.
Let’s explore it ↗